Applying “Big Data” to the Capacitor Industry in 2015
02/10/2015 //
Introduction and Definition of "Big Data"
One of the key trends in 2015 is "Big Data" which is an evolving term that describes any large volume of data that is structured or unstructured and that has the potential to be "data-mined" for information that can help persons in leadership positions make more accurate decisions based upon recurring trends and patterns. Such trends and patterns are ascertained through the capture, manipulation and control of massive amounts of recurring data. And while the tools required to capture, analyze and store massive amounts of high frequency data are still in their infancy, the practice is expected to grow dramatically over the coming years because the costs of capturing, storing and processing the data are declining which makes the practice of using "Big Data" accessible to even the smallest businesses, and potentially a true competitive advantage for those who embrace Big Data now. This MarketEYE article offers the reader an example of how "Big Data" can be applied to the capacitor industry to offer a breadth and depth of understanding that had been previously unattainable at such a grand level of design.
Future and Past "Big Data"
Paumanok Publications, Inc. views big data in two ways, "Future Data" and "Past Data." The concept of "Future Data" involves the utilization of the increasing number of low cost data collection devices available to Big Data architecture, such as the internet, email, RFID readers, electronic taggants, wireless sensor networks, digital and still cameras and information sensing smart phones. The concept of "Past Data" involves the identification of large-scale data sources that have been continually collected over decades in an electronic format and utilizing that "Past Data" to enhance a "Future Data" design. "Past Data" resources are important for defining corporate strategy, while "Future Data" resources are important tools in refining the strategy to taking advantages of tactical opportunities.
Applying Big Data to the Capacitor Industry in 2015
Paumanok has a unique perspective on data collection and storage that involves the global capacitor industry. For 27 years we have collected similar data sets and stored that data electronically almost exclusively in Microsoft Excel formats. We have also collected data on a monthly basis during that time period and currently maintain that data on cloud based storage systems. In recent years our database has become increasingly more important to large-scale corporations who have an express interest in the components business model; or who wish to apply capacitor data to a larger scale model. In certain grand "Big Data" models, the "legacy of data" becomes increasingly important, because the output can be influenced by multiple data sources pointing toward similar conclusions.
Data Volume, Variety, Frequency, Complexity and Analysis
Paumanok’s depth and breadth of capacitor related data is unmatched globally, and the volume of reliable data coupled with the fact that is monthly and goes back 27 years in the same format, and offers the user more than 300 individual data points stored in the same electronic format that makes it extremely valuable for Big Data consumers. Secondly, the variety of the Paumanok capacitor data is equally important. Paumanok maintains granular data that breaks down key areas of market intelligence into sub-sets; for example, in the case of capacitors the database has more than 300 data points for each key dielectric- ceramic, tantalum, film and aluminum sub-variations; and also maintains data on the value and volume of shipments and absolute price data. The data is further dichotomized based on all countries globally. Paumanok’s Past Data collection on the capacitor industry is also maintained on a high frequency basis, and includes monthly data going back to 1990. Complexity and Data Analysis is also a key part of the Paumanok database on capacitors. For example, during certain months over the past two decades, certain data shows huge spikes or troughs in demand, which are explained by either market conditions, or by unique aberrations in the cycle, such as a shift in product mix, price erosion in a key dielectric or a manufacturer closing a factory and moving production inventory to a new location.
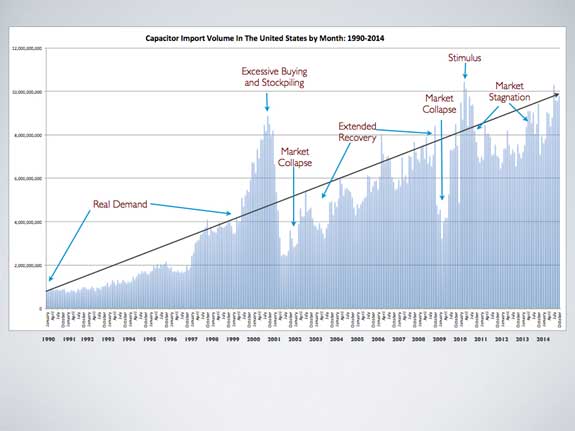
Figure 1: A Small Sample of "Big Data"
© 2015 Paumanok Publications, Inc. All Rights Reserved.
A Sample of Big Data Applied to the U.S. Capacitor Market
The majority of capacitor VOLUME consumption in the United States for example, has been satisfied by imports from offshore manufacturing locations since 1990. The chart above illustrates just a single facet in the complex U.S. capacitor market, but shows monthly import VOLUMES of capacitors (all types, configurations and dielectrics combined). Some important conclusions that can be derived from the chart above include the following:
- Capacitor Unit Demand in the United States Has Continued to Grow Consistently from 1990 to 2014
- Annual Unit Demand Peaks in the months of March, April and November, but in certain years the months of June, September and December can also show substantial month-to-month increases in unit demand in the United States market
- Peaks in the market can be substantial, but declines in the market can be brutal and deep
- Market increases can occur rapidly, as can market declines
Capacitor Sample – "Big Data" Analysis
An analysis of the chart on the previous page requires additional analysis. For example, the period from 1990 to 1997 had U.S. capacitor imports remain less than two billion pieces per month as demand levels in the computer, automotive, telecom and industrial electronics segments remained minimal; however, between 1997 and 1999, unit demand almost doubled on a monthly basis to almost four billion pieces per month, and this lead to an abnormal market situation where panic set in and major customers competed with each other to obtain capacitors, and this resulted in an over exuberance of buying with double and triple ordering and extended shortages largely within the calendar year of 2000 when monthly capacitor imports reached to almost nine billion pieces (In fact, the highest import volume recorded in the United States for capacitors during 2000 was in September of that year, when unit imports reached 8.875 billion pieces with an average unit price of $0.0305 and an import value of $271 million U.S. dollars). However, the excessive buying in 2000 resulted in stockpiling, which caused a severe market collapse in 2001 as net new demand for components dried up. In late 2002 however, the resilient U.S. market rebounded and demonstrated an extended period of market recovery through 2008. In fact in 2008, monthly import volumes reached almost as high as the aberration of 2000 (achieving 8.4 billion pieces in September of 2008 with a market value of $110 MM USD and an average unit price of $0.013 per unit), before the market, once again, collapsed in the global economic downturn of 2009 (which really began in November of 2008 in the U.S., but reached its low point in February of 2009 and remained stuck on the absolute market bottom until June of 2009 as the market started to slowly recover and then get a boost with the US stimulus package (The ARRA of 2009) which caused the market to peak at 9.77 billion pieces in June of 2010, and remain elevated through 2011 before succumbing to a state of anemia in 2012 and 2013, brought about by the weak yen to US dollar ratio. In 2014 we see clear signs of market improvements in the U.S. market and this looks as if it is extending into 2015 as well.
Benefits of Applying Big Data for a Capacitor Manufacturer or Distributor
Even though the chart and analysis are just one facet of the type of information that can be gathered from applying Big Data to a market, the benefits to a capacitor manufacturer or distributor can lead to improvements in supply planning which will add to product quality. Utilizing big data also allows for significant cost savings through greater efficiencies and increased productivity which will result in "Accurate Predictive Manufacturing and Stockpiling."
Additional Ways in Which Big Data can be Used in the Capacitor Industry
In the same data sets which provided the information in the prior illustration, we also maintain data on the monthly value of shipments as well as average unit pricing. The critical data is in the 300+ data points on pricing which can be used to establish the proper month-to month, quarter-to-quarter and year-over-year average rates of price erosion, which can be used to accurately forecast rates of future price erosion, including expected aberrations in the marketplace. The complexity of the data set is also granular and can show the variations in unit, value and pricing imports by product type and also reveal over an extended period do of time which component types and configurations are growing in demand at the expense of other capacitor products, and this in turn can be used to forecast predictive manufacturing going forward by component type. Another key result of big data is that for each type and configuration of capacitor it can ascertained over an extended period of time, which countries that manufacture the capacitors have the lowest costs to produce.
Summary and Conclusion
This MarketEYE article has been designed to highlight the current trend of applying the evolving concept of "Big Data" to the capacitor industry. The volume, frequency, complexity and analysis of large quantities of data is becoming more cost effective and its use may in fact prove to be a competitive advantage in increasing profitability and market share for those who adopt it, expand on it and use it wisely. This article shows just a small facet of how hundreds of data points can be combined into one visual document that allows the reader to draw conclusions and make decisions that are less driven by "hunches" and more driven be real data. The article also points to the fact that future data sets will continue to be more sophisticated and will employ real-time data from a variety of sensing devices throughout the supply chain while relaying on content providers who maintain databases with the depth and breadth of years of granular data. In the future we foresee multiple streams of data combined together to form a more perfect picture of tactical and strategic changes in the market and allow key decision makers to react quickly and decisively in the best interests of their respective companies.
Dennis M. Zogbi

Dennis M. Zogbi is the author of more than 260 market research reports on the worldwide electronic components industry. Specializing in capacitors, resistors, inductors and circuit protection component markets, technologies and opportunities; electronic materials including tantalum, ceramics, aluminum, plastics; palladium, ruthenium, nickel, copper, barium, titanium, activated carbon, and conductive polymers. Zogbi produces off-the-shelf market research reports through his wholly owned company, Paumanok Publications, Inc, as well as single client consulting, on-site presentations, due diligence for mergers and acquisitions, and he is the majority owner of Passive Component Industry Magazine LLC.