Shifting Mass Markets for Passive Electronic Components Shows Us the New Direction of the High-Tech Economy
09/05/2017 //
Introduction
The following tables break out global consumption of passive electronic components (capacitors, linear resistors and discrete inductors) by end-use market segment within preset categories. These tables are “definition dependent” and some readers may define these segments differently.
Paumanok has broken down the markets into subsets as follows, consumer electronics with emphasis on consumer audio and video imaging equipment (TV sets, and residential stereos; home theatre, game console, MP3, digital camera and smart home) telecommunications electronics segment, which includes all cell phones, landlines, base stations and central office equipment; the computer and business machine markets are also quite large, and include motherboards, monitors and hard disc drives followed by automotive, with emphasis on engine control units, ABS cards, entertainment and driver navigation systems; and the power and industrial market segment which includes power supplies and power transmission and distribution equipment, as well as large home appliances; and finally the specialty markets which include value-added and application specific markets in defense and medical, and down-hole pump which are small, but very profitable.
The following chart and subsequent section of this report describe passive component demand from each end-use market segment. It is important to note that in recent years demand from the telecom sector has increased so much that it has eclipsed demand from the consumer audio and video imaging markets in terms of dollar value. In fact, demand from consumer audio and video imaging segment has declined from the number one market segment to the number three market segment behind both telecom and computers over the past three years. This is due to the success of the smartphone and tablet computer, and the decline of the TV set.
The areas of consistent growth over the past few years have been the telecommunications sector, and the automotive sector, while the specialty sector has remained largely stable. The declining sectors have been in consumer AV and in the industrial sector. In FY 2017 we are noting stability in the computer markets for the first time in three years.
Telecommunications Equipment and the Passive Component Markets: FY 2017
The telecom sector is dominated by demand from the wireless handset business, with the movement from conventional cellular phones to “Smartphones” such as the Apple iPhone and the Samsung Galaxy a major driving force in the constant increase in unit shipments of MLCC, thick film chips, SMD chip inductors and ultra-small tantalum chip capacitors. The “Smartphone” has a considerably higher passive component content when compared to traditional legacy handsets, and the world is moving rapidly away from traditional phones toward Smartphones, and this single change in demand is having a tremendous impact on unit sales of passive components. We expect this trend to continue until 2017/2018 before saturation reaches a point that creates a slowdown in the growth rate for unit shipments of passive components. Most major vendors of passive components believe we have entered into a market environment where smartphones account for more than 80% of unit output of phones by type and therefore a slowdown in component demand because of global saturation rates is inevitable.
Other products included in the telecom sector are landline and cordless phones, GPS devices, telecommunications infrastructure equipment such as switches, routers and repeaters; PBX equipment, wireless base stations, cable modems and various forms of commercial satellites and related communication equipment.
It is important for the reader to appreciate that the growth rate in sales of smartphones far exceeds that of telecom infrastructure equipment. In FY 2017 Paumanok estimates that revenue growth in sales of passive components to wireless handset manufacturers (both smartphone and legacy feature phones combined) and telecommunications decreased by approximately 2.31% in U.S. dollars.
This decrease in revenues from the handset business has been an important factor in the reluctance for MLCC manufacturers to increase global capacity.
Figure 1: Telecom End-Use Markets For Passive Components: Global Consumption Value and Trend: 2007-2017
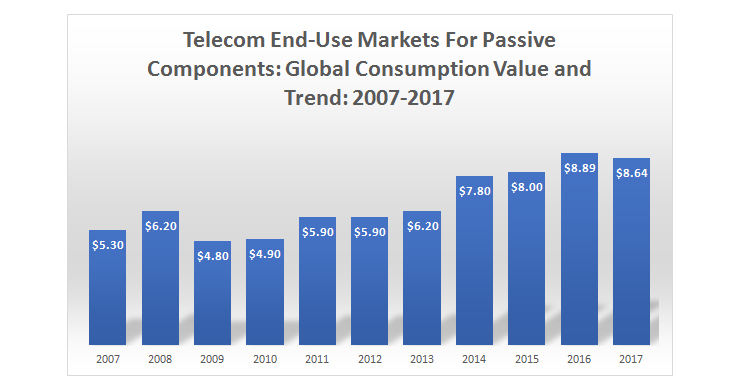
Source: Paumanok
Passive Component consumption in the telecom equipment (Both handsets and infrastructure) sector will total approximately $8.64 billion USD in FY 2017, down 2.3% from $8.9 billion USD in FY 2016 – after being up sharply about 11.1% in dollar value over FY 2015. In FY 2017 passive component demand from the telecom sector will represent about 37% of passive component consumption value worldwide, making telecom the largest end-use market segment for the year, beating out consumer AV and computers with growth related to component demand for smartphones- primarily MLCC and thick film chip resistors, but also tantalum chip capacitors and surface mount inductors as well.
The telecom sector has increased from 24% of global consumption value for passive components in FY 2010 to 37% of global consumption value in FY 2017. Smartphone consumption of passive components, especially MLCC and thick film chip resistors, has been the most important driving force behind consumption of passive components and innovation (i.e. miniaturization) since 2000 and vendors of passive components should be preparing for a market slowdown in revenues as smartphone shipments reach advanced states of saturation by population on a global basis. This trend of an anticipated slowdown in component demand is a key finding of this report for FY 2017.
Computer Markets for Passive Components: FY 2017
The computer and business machine segment, which includes motherboards, power supplies, monitors, hard disc drives, video graphics cards, modem cards and semiconductor chipset boards; as well as scanners, printers, fax machines, Point of Sale machines and photocopiers, will account for 18% of capacitor, resistor and inductor revenues in 2017 FY, worth about $4.47 up by 10% in value from the $4.1 billion USD. Computers consume large volumes of higher priced capacitors, resistors and inductors, and demand for high capacitance MLCC, tantalum chips and aluminum chip capacitors is dependent on the computer market for year-over-year growth. In FY 2016 the market declined in dollar value by 13.5% to $4.1 billion USD due to unexpected declines in all computer product markets including tablets, notebooks, desktops and servers as it is now apparent that wireless handsets, especially large screen format handsets are now eating into the entire computer market, including eating into the tablet market. In FY 2016, Paumanok estimates that computer unit demand dropped 7.3% from 560 million units in FY 2015 to 519 million units in FY 2017. The notebook computer market declined by 6.95% to 174 million units consumed; the tablet computer market dropped by 7.9% from 252 million units in FY 2015 to 232 million units in FY 2016, and the desktop/server market dropped from 121 million units in FY 2015 to 113 million units in FY 2016 a drop of 6.61%. The value of consumption for passive components consumed in computers increased in FY 2017 by 10% in dollar value due to the change in currency valuation and a weakened dollar.
Figure 4: Computer End-Use Markets For Passive Components: Global Consumption Value and Trend: 2007-2017
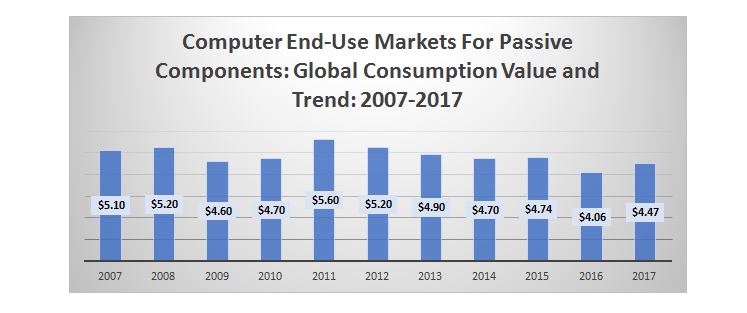
Source: Paumanok
Consumer Audio and Video Imaging Markets for Passive Components: FY 2017
Consumer electronics is a broad category and many of the top Japanese vendors of passive components to the segment further dichotomize the market into consumer audio and video imaging equipment. The other popular term is home theatre electronics, which is even more encompassing and is an entrée into smart home electronic technology of the future. Consumer audio and video imaging equipment HAD BEEN the largest segment for consumption for all passive components in dollar value; however, it has been eclipsed by both the telecom and computer market segments over the past three years. It is still a valuable segment and the large volume of demand is from the television set, game console, MP3 player, digital video camera, digital still camera and stereo market segments. Many of the peripheral markets, such as potable game consoles, MP3 players, digital cameras and portable GPS devices have declined due to the success of the smartphone, which offers the consumer the functionality of these devices in the “converged” smartphone.
Passive component consumption in the consumer electronics equipment sector totaled approximately $3.41 billion USD in 2017 (FY), UP 1% from FY 2016, and accounted for 12% of demand for all passive components in terms of dollar value (down from a whopping 28% in FY 2010). The global TV set market has experienced excess channel inventories. Also, an additional factor is weighing heavily in the segment competition from smartphones is making digital cameras, MP3 players and portable game consoles redundant, and having a negative impact on component supply to the overall consumer AV markets.
Figure 5: Consumer AV End-Use Markets for Passive Components: Global Consumption Value and Trend: 2007-2017
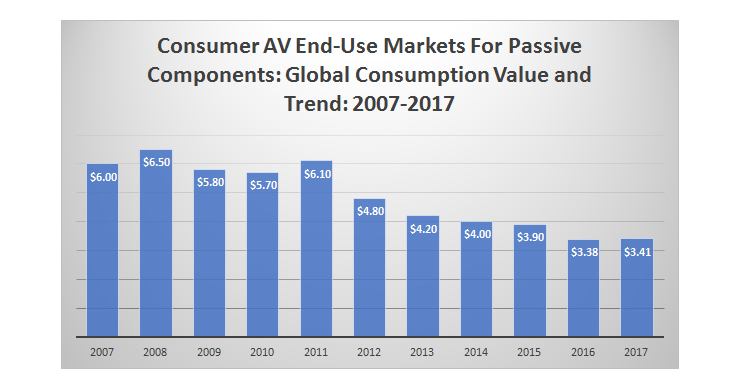
Source: Paumanok Publications, Inc.
We believe that the consumer electronics markets will have to offer substantial features and improvements at lower prices for the markets to be viable against smartphones (i.e. more pixels in digital cameras, better sound quality in Mp3). And we still believe that the TV set market is ripe for something new and exciting. 4K television sets seem to be the next wave of product to appeal to the consumer at (somewhat) reasonable pricing. Curved TV sets on the other hand, are extraordinarily expensive and may take years to get enough volume to lower prices. In the end, though we believe that TV sets have the potential to grow given the right mix of technology and pricing. In FY 2017, we noted that some vendors of inductors reported better than expected sales of 4K TVs due to brisk end-market sales in Japan. Regardless, overall TV set production worldwide in FY 20167 declined by 8.1% to 215 Million sets.
Automotive Markets for Passive Components: FY 2017
Automotive electronics include engine control units, ABS cards, SRS electronics, car stereos, HVAC systems, driver information and diagnostic systems, powertrain electronics, HEV integration, door locks, seat motors, interior and exterior lighting, instrument clusters and related electronics. Passive component consumption in automotive electronic subassemblies totaled approximately $3.62 billion USD in 2017 FY, up 8.3% year on year in S dollars and accounted for about 15% of overall passive component consumption for the year. Passive component revenues in FY 2016 were down by about 6.1% on a year-over-year basis compared to FY 2015. In FY 2013 and again in FY 2014 automotive electronic demand for passive electronic components increased due to lease expirations and an aging fleet of class 3 to 7 sedans and light trucks in established economies and continued demand for automobiles in emerging economies. The combination of an increase in electronic content per automobile, coupled with increased unit sales of cars and light trucks globally has increased the automotive sector from 9% of total passive component consumption value in FY 2010 to 15% in FY 2017.
Figure 6: Automotive End-Use Markets For Passive Components: Global Consumption Value and Trend: 2007-2017
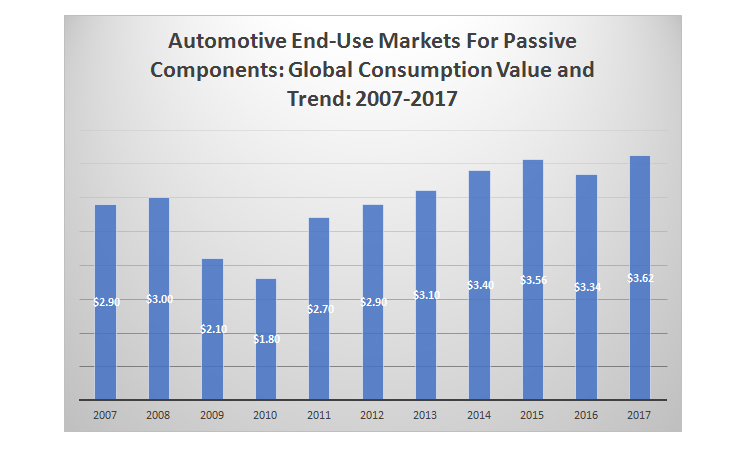
Source: Paumanok Publications, Inc.
Industrial and Power Markets For Passive Components: FY 2017
The industrial and power segment consumed about 10% of all passive components (capacitors, linear resistors and discrete inductors) in 2017 FY or approximately $2.34 billion. This segment experienced almost no change in revenues year-on-year in FY 2017 on a year-over-year basis. This basket category of products includes (primarily) power transmission and distribution capacitors, power supplies, large home appliances, renewable energy systems, switchgear and switchboard apparatus and motor controllers. Power film capacitors, screw terminal aluminum electrolytic capacitors, high voltage ceramic capacitors, and wirewound and nichrome resistors, and power inductors are consumed in this segment of the market. Consumption in this sector declined from 12% of total passive electronic component consumption in FY 2010 to 10% in FY 2017.
This market had experienced significant activity related to power efficiency and for DC link circuits for renewable energy systems in wind and solar farms. This had a positive market effect on polypropylene film capacitors and large can aluminum electrolytic capacitors. However, the decline in the European economy put a strain on new wind and solar farm developments in Germany and Italy, the world’s two largest markets for renewable energy systems as both countries altered their feed-in tariffs making the massive projects less attractive and thus causing many vendors in the supply chain to look toward the USA and China for market growth. Overall this caused a slowdown in passive component demand to the sector in FY 2015 but then in FY 2017, with the plunge in fuel oil prices (crushing fuel and alternative energy strategy initiated by the House of Saud – brilliant), the component demand was slowed by lack of interest in renewables with prices at the pump so incredibly low. This of course, fueled the car markets, especially in the USA where fuel taxes are amongst the lowest in the world.
Figure 7: Figure 22: Industrial End-Use Markets For Passive Components: Global Consumption Value and Trends: 2007-2017
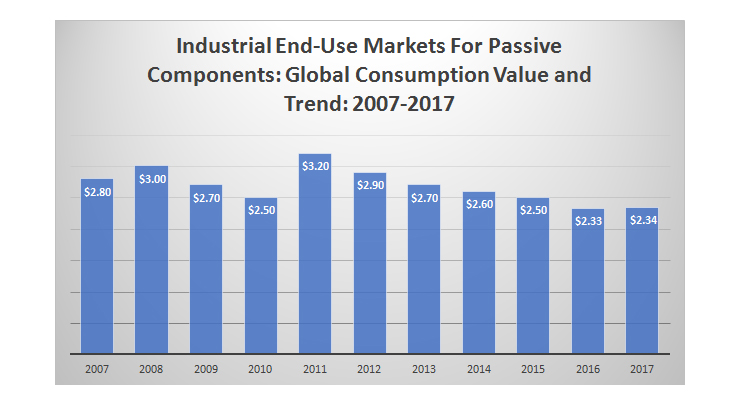
Source: Paumanok
The industrial and lighting sector, as well as the telecommunications infrastructure segment is significantly down due to the lack of available government funding for desperately needed infrastructure projects around the world. This is an area to watch closely because the space will require emergency funding at some point or established infrastructures will fail. It is also a key economic indicator of the revival of MINT countries and other struggling nations. (i.e. when Sudan installs a power transmission station it requires a lot of power film capacitors, which is activity we at Paumanok can track).
Specialty Electronics Segment (Defense, Medical, Oil and Gas, Mining and Other): FY 2017
The specialty electronics market segment includes five discernible sub-segments, medical electronics, oil well electronics, mining electronics and defense electronics (we include a fifth category to include all other unique segments that require unusual voltages or operate at unusual frequencies or at different levels of chemical, gas or radiation exposure, or at elevated temperatures to 350 degrees C). Defense is by far the largest segment, accounting for 68% of the specialty electronics markets worldwide. The medical segment is the most demanding, but also the most profitable segment. Oil and gas electronics are also quite demanding and very profitable components market segment, but one that has plunged in 2017 and dragging down the entire specialty passive component market with it including 4.3% overall segment decline This segment of the passive component market is an estimated $0.820 billion in value in prior 2016 (4% on global demand for all passive components) for FY 2016, down 9.4% year-over-year due to a steep drop in the number of offshore oil drilling platforms and their subsequent lack of a requirement for logging tools (a bubble burst that few saw coming), with medical device demand up; but defense and oil and gas electronics demand down. Defense market demand has stagnated due to a freeze on defense spending in the United States, while oil and gas electronics markets have been hit hard by the drop in crude oil prices. Medical devices on the other hand, have continued to grow in all segments of the market with some impressive increases in electronics direct to consumers to compete against drug therapy, and impressive changes in technology surrounding implantable defibrillators and related sensing and scanning devices. The major vendors of passive components to this segment include AVX Corp., Vishay, and KEMET Electronics; but also many smaller vendors who specifically serve this segment in industrialized nations (USA, UK, Germany, France) but where there is obviously a shift now toward Asia as well, with China moving now into both high voltage and high frequency component designs (Holystone, Dalian Dalakai).
Figure 8: Specialty End-Use Markets for Passive Components: Global Consumption Value and Trends: 2007-2017
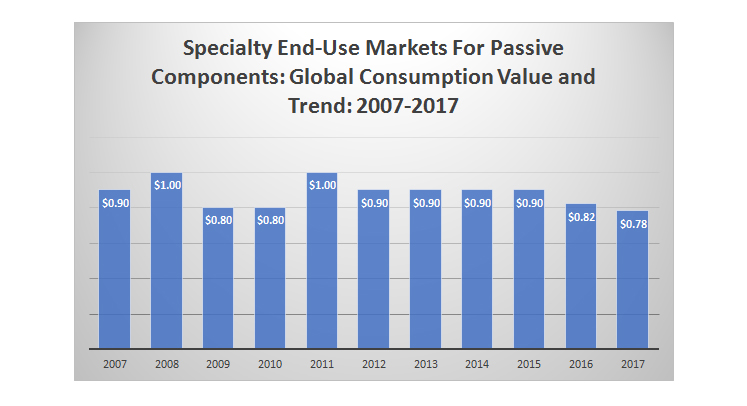
Source: Paumanok
Historical Trends and Directions in Demand for Passive Components by End-Use Market Segment to FY 2015
The following chart and table illustrate the changes in demand for passive electronic components between FY 2007 and FY 2017. The reader will note that during this time period that demand from the telecommunication segment and the automotive segment has increased, while demand from the consumer audio and video imaging segment, the computer segment and the industrial segment has declined. The “other” specialty market segments have largely remained unchanged during this time period. So some from a strategic perspective, it is easy to calculate that the handset is replacing all other portable and personal electronic devices. This is remarkable because early on the speculation was that handsets would in fact replace all other devices (Nokia used to say this in passive component related speeches at CARTS back in 1995); but then they were wrong, the handset augmented other devices at first, giving a boost to both technologies, but eventually, over time, the consumer did in fact move toward the handset in a large way, at the EXPENSE of many other products. So technology can be adopted, augmented and then dominate the space; and this is an important message for the new century. Therefore going forward, companies must adhere to a specific strategy that (1) creates value through direct sales of components to the wireless handset industry; or (2) focus on specialty electronics segments; or (3) take advantage of the power and lighting segment under the pretense that global infrastructures must begin to be repaired or they will fail, or, (4) all of the above.
Figure 9: Global Value of Consumption Trend for Passive Components by End-Use Market Segment: 2007-2017
(In Billions of USD)
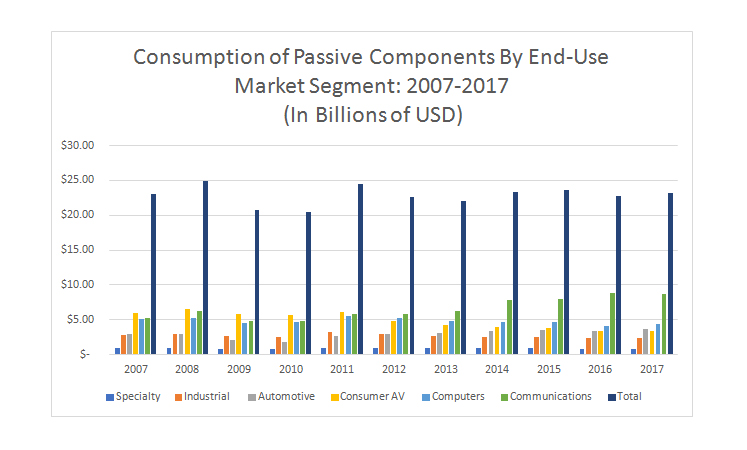
Passive Components include fixed capacitors, linear fixed resistors and inductors.
Source: Paumanok Publications Estimates 2017- numbers have been rounded in Billions of USD
For each fiscal year above ending March
Dennis M. Zogbi

Dennis M. Zogbi is the author of more than 260 market research reports on the worldwide electronic components industry. Specializing in capacitors, resistors, inductors and circuit protection component markets, technologies and opportunities; electronic materials including tantalum, ceramics, aluminum, plastics; palladium, ruthenium, nickel, copper, barium, titanium, activated carbon, and conductive polymers. Zogbi produces off-the-shelf market research reports through his wholly owned company, Paumanok Publications, Inc, as well as single client consulting, on-site presentations, due diligence for mergers and acquisitions, and he is the majority owner of Passive Component Industry Magazine LLC.