North American Switch Market Sales Rose 7% and Bookings Up 11% in Q1 2017 Vs Q4 2016
11/30/2017 //
Total reported sales for all switch categories in North America for Q1 of 2017 were 7% above the previous quarter and 1% better than the first quarter of 2016. Sales units for Q1 2017 ran 11% more than the units sold in Q4 2016 and 3% above Q1 of 2016.
The total booking dollars reported for all switch categories in North America for Q1 2017 came in 11% more than the previous quarter and 1% higher than Q1 2016. The first quarter’s book-to-bill ratio for dollars was 1.039. Booking units in Q1 2017 were 9% above Q4. The first quarter’s book-to-bill ratio for units was 0.878.
The first quarter versus the fourth shows total sales dollars up 7% on the strength of the majority of categories. Units were also up for the majority categories and increased 11% in total on the strength of snap action and tact categories. Prices were down 4% in total with all but keylock and push button decreasing. The comparison to the first quarter of 2016 has dollars and units increasing 1% and 3%. Over half the categories saw dollars decrease. Units were higher for most categories and rose in total on the strength of snap action, keylock, and toggle categories. Pricing from a year ago down for all but rockers and lower in total by 2%.
Sales Growth by Switch Category
|
Q1 2017 Versus Q4 2016 |
Q1 2017 Versus Q1 2016 |
||||
|---|---|---|---|---|---|---|
Category |
Dollars |
Units |
ASP |
Dollars |
Units |
ASP |
DIP |
7.9% |
9.2% |
-1.3% |
-13.7% |
-12.2% |
-1.7% |
Keylock |
1.9% |
-2.1% |
4.1 % |
-0.7% |
11.1% |
-10.6% |
Push Button |
1.3% |
-1.6% |
2.9% |
1.8% |
5.2% |
-3.2% |
Rocker |
-8.6% |
-1.9% |
-6.9% |
-6.3% |
-7.3% |
1.1% |
Slide |
1.2% |
15.8% |
-12.6% |
-11.8% |
6.3% |
-17.0% |
Snap Action |
14.3% |
15.0% |
-0.6% |
13.1% |
31.7% |
-14.1% |
Tact |
6.5% |
11.8% |
-4.7% |
-3.5% |
5.2% |
-8.3% |
Toggle |
5.6% |
10.3% |
-4.3% |
14.1% |
18.7% |
-3.9% |
Total |
7.2% |
11.5% |
-3.9% |
1.2% |
3.5% |
-2.3% |
When compared to last quarter, total booking dollars rose 11% and units were up nearly 10% with the majority of categories increasing. Booked prices were up almost 2% in total with increases in half of the categories. Booked dollars and units, and booking price in Q1 against the same quarter of 2016 were up 1% and 3% respectively on the strength of snap action and mixed results by pother categories. The average booking prices were down over 1% with losses in all but rocker switches.
Bookings Growth by Switch Category
|
Q1 2017 Versus Q4 2016 |
Q1 2017 Versus Q1 2016 |
||||
|---|---|---|---|---|---|---|
Category |
Dollars |
Units |
ABP |
Dollars |
Units |
ABP |
DIP |
8.2% |
1.1% |
7.0% |
-4.7% |
-3.5% |
-1.3% |
Keylock |
5.7% |
-7.1% |
13.8 % |
-19.6% |
-15.9% |
-4.4% |
Push Button |
0.5% |
6.1% |
-5.2% |
-12.1% |
4.6% |
-16.0% |
Rocker |
6.0% |
7.0% |
-1.0% |
4.5% |
-1.9% |
6.5% |
Slide |
14.6% |
-0.5% |
15.2% |
-13.9% |
0.4% |
-14.3% |
Snap Action |
17.4% |
20.2% |
-2.3% |
25.3% |
80.7% |
-30.7% |
Tact |
6.5% |
9.2% |
-2.5% |
-11.0% |
-7.0% |
-4.3% |
Toggle |
13.9% |
12.3% |
1.5% |
-7.1% |
2.7% |
-9.5% |
Total |
11.4% |
9.7% |
1.6% |
1.4% |
3.0% |
-1.5% |
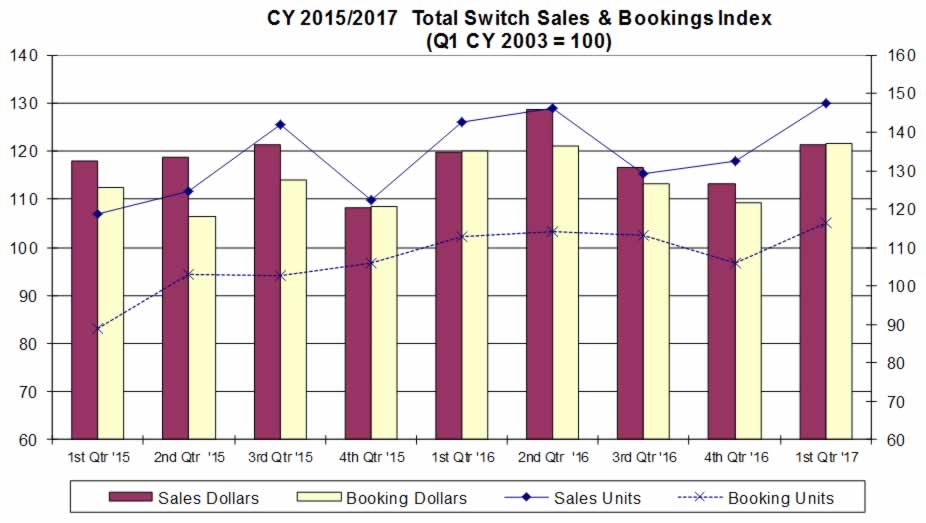
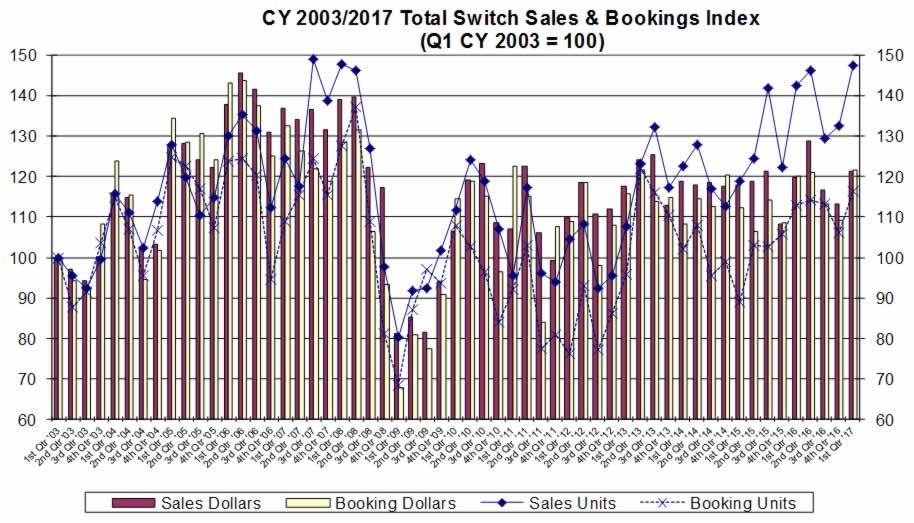
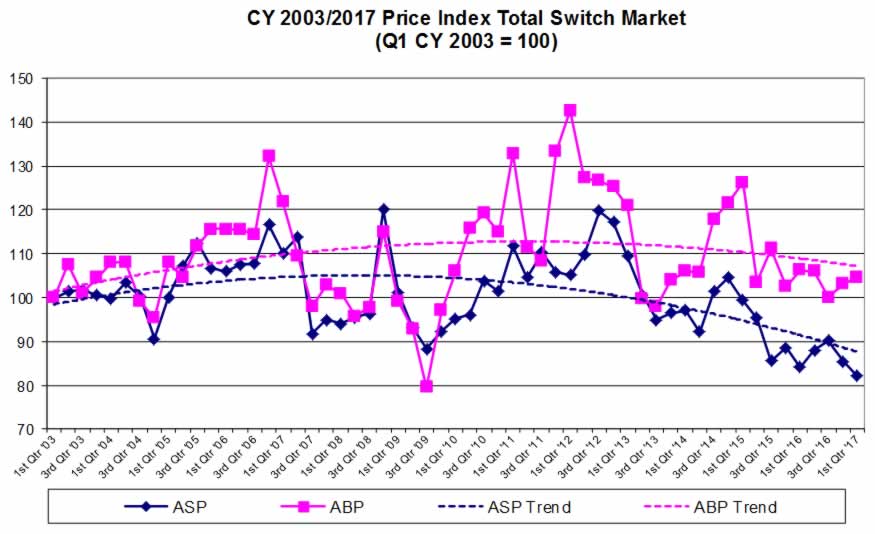
The graph below shows total quarterly indexed sales and bookings in dollars and units for the reported data since Q4 CY 2014. Both dollars and units improved in in Q2 and Q3 of 2015 then fell sharply in Q4. The second graph of indexed sales shows sales units are at decade highs. Both improved the first two quarters of 2016 then fell in Q3 and Q4 then recovered in Q1 of this year. Booking units generally fell to a low in Q1 2015 and have improved until Q3 and Q4 of last year but regained in Q1. Booked dollars were mainly flat, except for Q2 and Q4 of 2015, then picked up in the first half 2016, fell in Q3 and Q4, and came on strong in Q1 of this year.
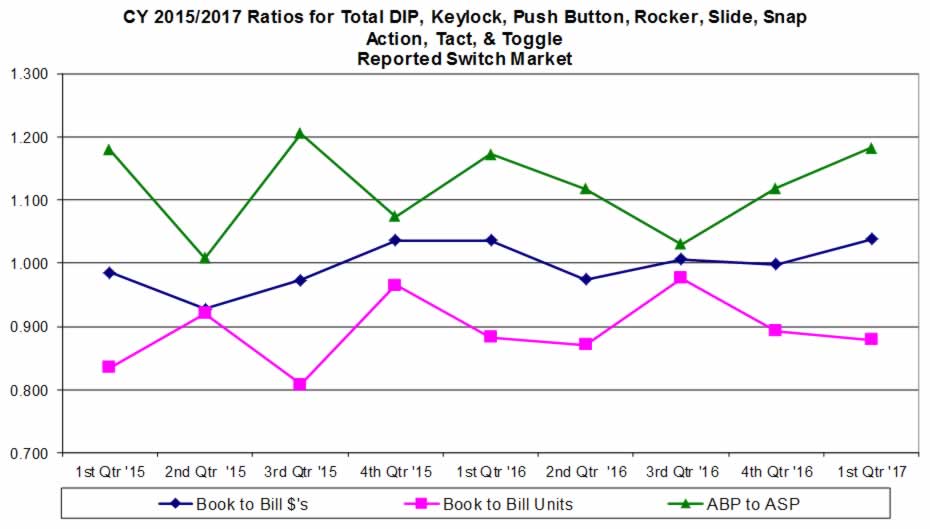
Book-to-bill units have been 1.0 for the last two years. Book-to-bill dollars have oscillated above and below 1.0 over the last two years. The booking to selling price ratio has been well above 1.0 for period.
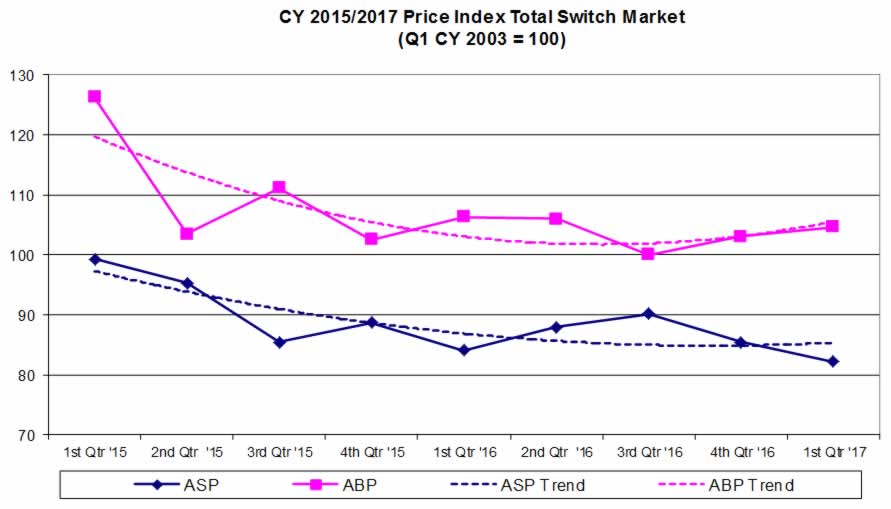
Indexed booking prices general increased to a peak in the first half of 2015 and fell dramatically the last seven quarters. Indexed selling prices improved until the start of 2015 and have generally declined since and are at a Switch Tracks all-time low as shown in the second graph below.
Michael Schwert

Michael is the founder of Cumulus, Inc. He has more than 30 years of marketing and sales as well as design experience in the electronic and electrical component industry. Prior to founding Cumulus, he was Director of Marketing for Cherry Electrical Products and held other marketing management positions with Panduit, BRK Electronics, and Ideal Industries.
Cumulus provides market information and consulting services for the global electronic components industry. The company offers three publications: Switch Tracks, a quarterly report with market information on component switches; the Relay Report, a quarterly report with market information on component relays; and Market Notes, a monthly report on sales, bookings, and business conditions in the relay and switch market. Cumulus also manages projects that help leading global suppliers in the relay and switch industry to develop new products and reach new markets.
Schwert provides MarketEYE with monthly articles that include timely and accurate market information for the electromechanical component sector of the electronics industry.