Raw Material Supply Chain for Passive Components: Global Market Update: June 2015
1.0 An Introduction to the Passive Component Raw Material Index
The Passive Component Raw Material Index (which covers feedstock pricing for many of the primary raw materials consumed in the production of passive electronic components) showed a DECREASE in JUNE on a month-to-month basis of (2.9%) following month-to-month DECREASES in pricing all year.
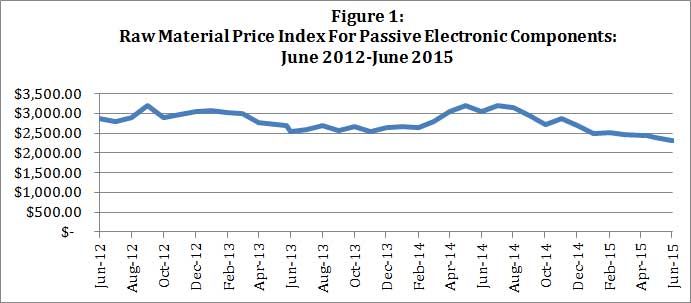
Source: ©2015 The Passive Component Raw Material Index: Paumanok Publications, Inc. Shows Aggregate Pricing for key Feedstocks Consumed as the Primary Dielectric material, resistive element, electrode or termination material.
2.0. How Materials Impact Passive Electronic Component Costs to Produce
Raw materials impact the overall costs to produce electronic components. Any fluctuation in price or availability for these key feedstocks can have a negative impact on profit margins. Therefore we track the following items in the index.
2.1 Nickel: Nickel is the primary electrode material consumed in high capacitance multilayered ceramic chip capacitors (MLCC). The fluctuations in nickel price are primarily the result of competition for the metal with the steel industry, where it is used as a hardener. Nickel supply is in turn important for the production of X5R, Y5V and X7R MLCC; which are the capacitors of choice for the operation of smartphones, tablets and TV sets.
2.2 Copper: Copper engineered powders are consumed in the production of MLCC as well, but as the termination material consumed in conjunction with the nickel type electrode. Therefore copper and nickel are an important type of base metal duo. Copper is used in some MLCC electrode systems because unlike its counterpart nickel it is non-magnetic.
2.3 Aluminum: Etched anode and cathode foils are consumed as the dielectric layers of aluminum electrolytic capacitors the world over. Aluminum comes from Bauxite, which is a mined material and whose price is easily calculated. Aluminum is abundant in the Earth’s crust and its price has been historically stable. Aluminum electrolytic capacitors are important components consumed in power supplies, television sets, computers and power electronics, including renewable energy systems.
2.4 Zinc: Zinc is used as an additive in ceramic chip capacitors and as the primary ingredient in the production of metal oxide varistors, which are consumed for circuit protection components in all known AC line voltage equipment.
2.5 Palladium: Palladium is a platinum group metal that is mined in South Africa and Russia, among other locations; and is consumed primarily for autocatalysts, but also for jewelry; and as the primary electrode material is precious metal based MLCC, which are in turn used in high reliability, high temperature and high voltage product markets globally.
2.6 Ruthenium: Ruthenium is a precious metal that is similar to that of palladium, but its primary purposes is to be consumed in all thick film chips and networks produced worldwide.
2.7 Tantalite: The tantalite metal used in the production of tantalum capacitors comes from Central Africa (2015). Other known tantalite resources are located in Australia, Brazil and Canada. Tantalite’s primary use is as capacitor grade tantalum metal powder for consumption in capacitor anodes. Tantalum capacitors are consumed in communications networking equipment, smartphones, automotive, medical and defense electronics.
2.8 Silver: Silver is consumed as a termination material for many electronic components, but primarily for MLCC that employ precious metal electrodes. MLCC with precious metal electrodes and silver terminations are in turn consumed in high voltage, high temperature and high reliability end-use market segments.
2.9 Oil: Crude oil pricing is of interest because it sets the stage for so many other commodities, but is also included because in any wild swings in its supply would impact the plastics industry, which in turn would impact the film dielectric capacitor segment. Film capacitors are consumed in both DC and AC circuits and are primarily associated with power related equipment, lighting and home appliances.
Figure 2: Materials Relationship With Passive Components: 2015
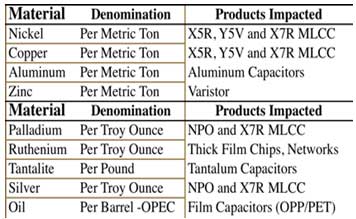
Source: Paumanok Publications, Inc.
3.0 Base Metal Pricing Trends
Base metal material prices decreased by 2.52% in June 2015 following volatile price fluctuations since July 2014 on a month-to-month basis. The decrease in pricing was evident in aluminum, copper and zinc, while pricing for nickel stabilized.
Figure 3: Base Metal Raw Material Price Index For Passive Electronic Components: June 2012 to June 2015
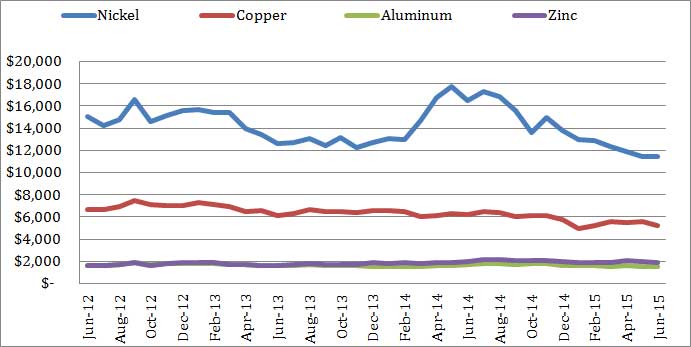
Source: ©2015 The Passive Component Raw Material Index: Paumanok Publications, Inc. Shows Aggregate Pricing for key Feedstocks Consumed as the base metal matrix- nickel, copper, aluminum and zinc, which in turn impacts the MLCC, aluminum capacitors and varistors markets respectively.
3.1 Nickel Pricing Trend
Nickel pricing fluctuates with the health of the Chinese economy; as it is primarily consumed in steel, and steel is in great demand in China. These price fluctuations from other external sources also impact the cost to produce high capacitance MLCC -where nickel is used as the electrode.
Figure 3 (A): Nickel Raw Material Price Index for Passive Electronic Components: April 2012 to June 2015
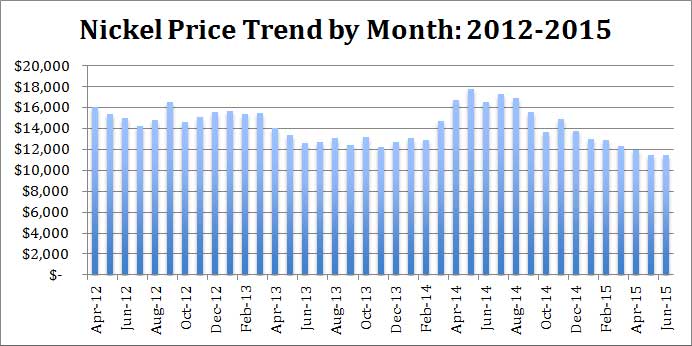
Source: Paumanok Passive Component Index through June 2015. Nickel price is in US Dollars per Ton.
3.2 Copper Pricing Trend
Copper has demonstrated less volatility when compared to its sister metal nickel; and in fact has shown slow but consecutive price reductions price from 2012 to 2015. Copper is used as the termination material in MLCC that have nickel electrodes.
Figure 3 (B): Copper Raw Material Price Index for Passive Electronic Components: April 2012 to June 2015
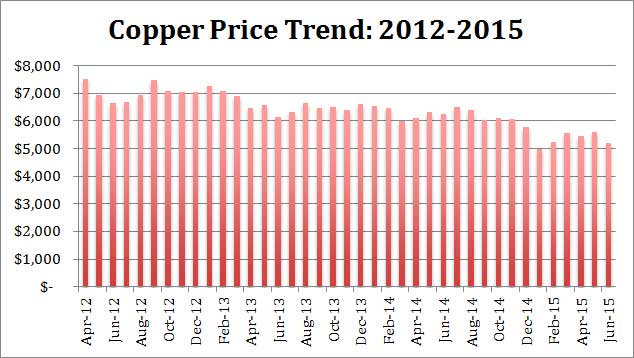
Source: Paumanok Passive Component Index through June 2015. Copper price is in US Dollars per Ton.
3.3 Aluminum Price Trend
The aluminum price trend has been steady. The pricing undulates and follows a pattern, but the pattern seems to be consistent and therefore easily planned for. Aluminum foil is consumed as the primary dielectric in aluminum electrolytic capacitors and this market is very sensitive to costs and price fluctuations.
Figure 3 (C ): Aluminum Raw Material Price Index for Passive Electronic Components: April 2012 to June 2015
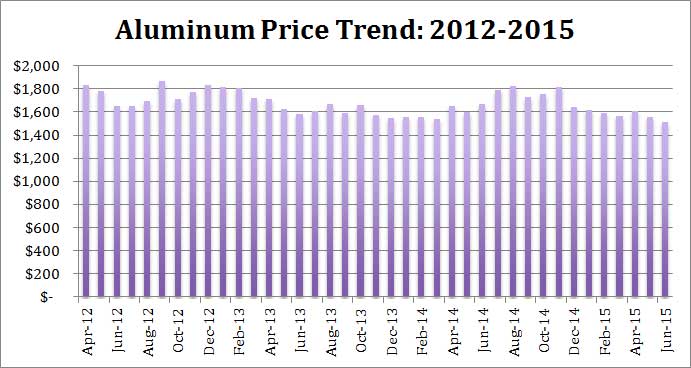
Source: Paumanok Passive Component Index through June 2015. Aluminum price is in US Dollars per Ton.
3.4 Zinc Price Trend
The price trend for zinc is an excellent example of what can occur to a primary raw material as it can be effected by supply and demand imbalances. In the instances of zinc and just recently, the amount of available zinc above ground was a matter of speculation which caused the price to rise. Zinc is used as an additive in ceramic capacitors and as the primary material in zinc oxide varistors.
Figure 3 (D): Zinc Raw Material Price Index for Passive Electronic Components: April 2012 to June 2015
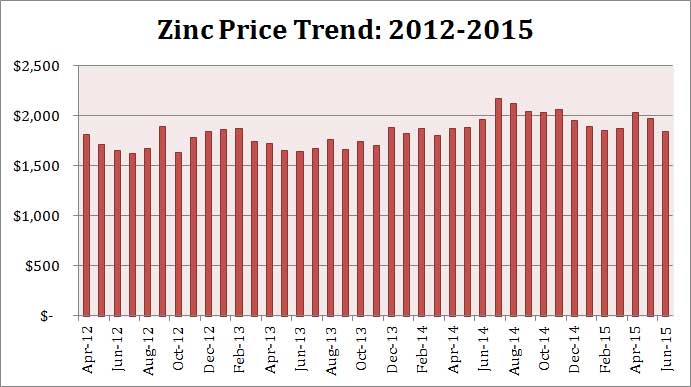
Source: Paumanok Passive Component Index through June 2015. Zinc price is in US Dollars Per Ton.
4.0 Precious and Rare Metal Pricing
Precious and rare metal prices on the other hand decreased by 12.04% In June 2015 on a month-to-month basis, one of the largest one-day drops in precious metal history. The palladium price plunged in June due to investors speculating that there is too much palladium above ground in reserves. Silver prices were also down, as was tantalite and ruthenium.
Figure 4: Precious Metal Raw Material Price Index for Passive Electronic Components: June 2012 to June 2015
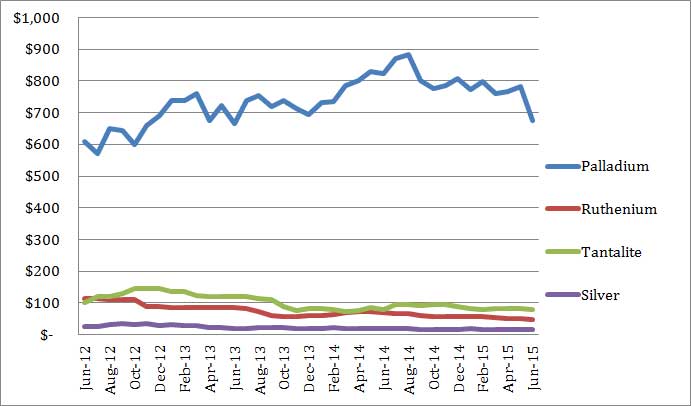
Source: Paumanok Passive Component Index through June 2015
4.1 Palladium Price Trend
The price of palladium had been slowly increasing in value since 2014, however, in 2015 the palladium price began to shrink and in June 2015 it showed a steep decline. This activity is based on speculators once again betting on how much material is above ground. Palladium is consumed in MLCC electrodes for specialty electronics applications.
Figure 4 (A): Palladium Raw Material Price Index for Passive Electronic Components: April 2012 to June 2015
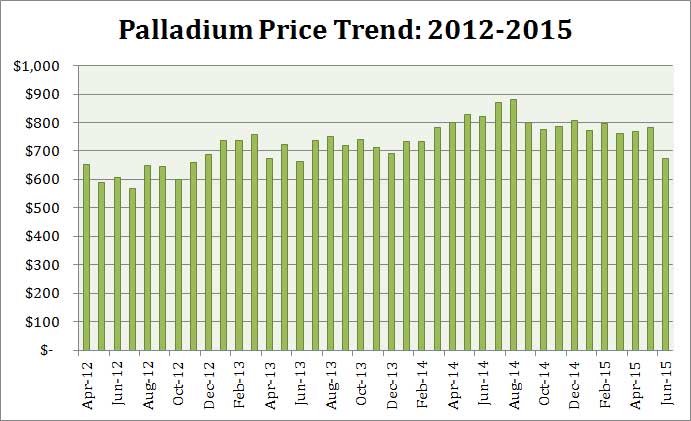
Source: Paumanok Passive Component Index through June 2015, In US Dollars per Troy Ounce
4.2 Ruthenium Price Trend
The Ruthenium price trend has been down from 2012 to 2015. Even though there are minor uses for ruthenium as a cracking catalyst and as a specialty metal for disc drives; the primary use remains the resistive layer for thick film resistors. The drop in price for ruthenium materials has been a blessing for thick film chip resistor manufacturers.
Figure 4 (B): Ruthenium Raw Material Price Index for Passive Electronic Components: April 2012 to June 2015
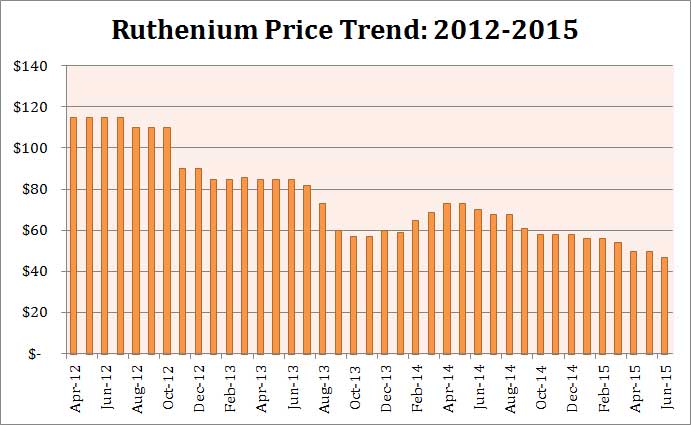
Source: Paumanok Passive Component Index through June 2015, In US Dollars per Troy Ounce
4.3 Tantalite Price Trend
Also trending downward has been the price of tantalite between 2012 and 2015, the primary use of the tantalite ore is for engineered tantalum powder consumed in capacitor anodes. Regardless, even minor shifts in materials pricing has been felt up and down this very tight supply and highly scrutinized supply chain.
Figure 4 (C ): Tantalite Raw Material Price Index for Passive Electronic Components: April 2012 to June 2015
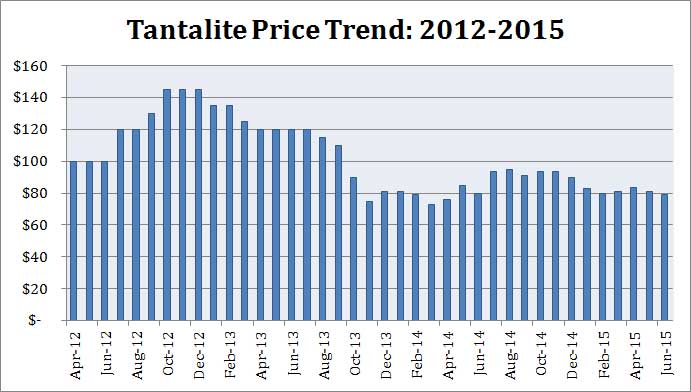
Source: Paumanok Passive Component Index Through June 2015. Tantalite is in US Dollars per Pound.
4.4 Silver Price Trend
The price trend for silver has also been downward consecutively since 2012 and moving even lower in 2015. Silver is the termination metal of choice consumed in the production of specialty MLCC.
Figure 4 (D): Palladium Raw Material Price Index for Passive Electronic Components: April 2012 to June 2015
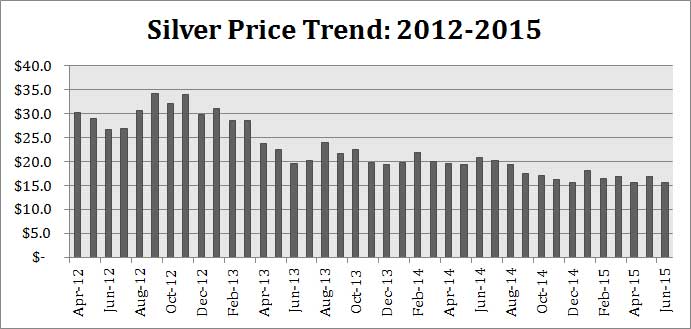
Source: Paumanok Passive Component Index through June 2015, In US Dollars Per Troy Ounce
5.0 Overall Price Index: Summary and Conclusion: June 2015
The Passive Component Raw Material Index has shown consecutive price reductions for many key raw materials from 2012 to 2015. Prices for ruthenium, tantalite, and silver have showed the greatest decline in overall prices per pound from 2012 to 2015. Nickel and copper have demonstrated unusual volatility during this time period with pricing stable to down. Aluminum pricing has remained largely stable and unchanged. Zinc costs continue to slowly increase but consecutively, over time it is a clear trend.